Beyond open rates — what to track if you care about behavior and retention
In today’s customer-centric marketing landscape, journeys have replaced campaigns as the focal point of engagement strategies. Yet, many marketers still rely on surface-level indicators like open rates and click-through rates to evaluate performance. While these metrics are easy to measure, they rarely tell the full story — especially if your goal is to drive meaningful behavior and improve retention.
This article explores the deeper, more insightful metrics that actually show whether a journey is working. If you’re serious about understanding customer behavior and improving retention, these are the numbers that matter.

1. Why Open Rates and Click Rates Aren’t Enough
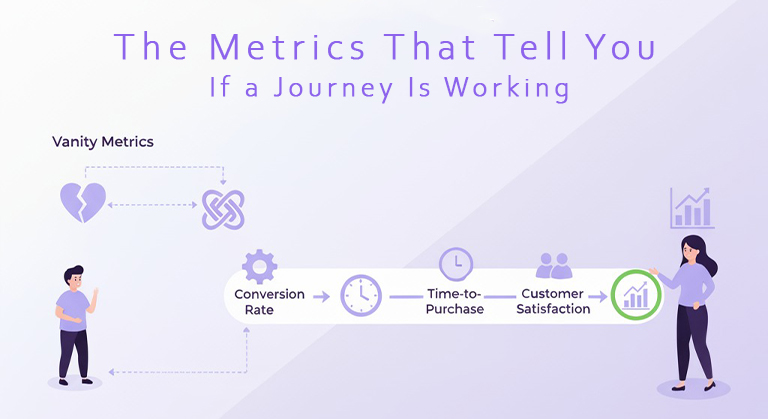
Open rates tell you if someone opened your message, and click rates tell you if they clicked. But neither metric reveals whether the message led to any meaningful action. Opens and clicks can inflate your sense of success while masking drop-offs further down the funnel.
In an era where privacy changes (e.g., Apple Mail Privacy Protection) are also impacting tracking accuracy, marketers must shift their focus from these vanity metrics to outcomes that reflect actual user engagement and behavior.
2. Engagement Depth: Session Duration, Scroll Depth, and Content Consumption
When a user interacts with your journey, how much time do they spend with your content? Do they scroll through it, consume key information, or bounce quickly?
Metrics like session duration and scroll depth provide a more nuanced picture of user interest. For example, a customer who clicks a link and spends five minutes exploring your content is far more engaged than one who clicks and immediately leaves.
Tracking these behavioral signals helps determine if your journey content is compelling and relevant enough to hold attention.
3. Action Completion: Micro and Macro Conversions
Ultimately, every journey has an intended outcome — whether it’s signing up for a program, completing a profile, adding a product to a cart, or making a purchase.
Track both micro-conversions (smaller steps along the way, such as viewing a product video or saving an item to a wishlist) and macro-conversions (final goals like purchases or subscriptions). This provides insight into whether your journey is effectively guiding users toward meaningful actions.
4. Time-to-Next-Action: Measuring Momentum
An effective journey should drive momentum. Are users quickly progressing from one step to the next? Or is there a delay between your communications and their subsequent action?
Time-to-next-action measures the average time between journey touchpoints and customer responses. Faster progression often correlates with higher engagement and a more seamless journey experience.
If this metric is lagging, it may suggest friction points or poor content alignment at certain stages.
5. Drop-Off Points and Silent Exits
Where do users disengage from your journey? Identifying drop-off points is critical to optimizing flows and removing friction.
Silent exits — where users stop engaging without explicitly opting out — can indicate content fatigue, irrelevant messaging, or an overly complex journey.
Analyze journey-level attrition to pinpoint stages where improvements can retain more users.
6. Retention Rate Over Time: Cohort Analysis
One of the best indicators of a successful journey is whether it positively influences customer retention.
Use cohort analysis to track retention rates over time, comparing users who have been through specific journeys with those who haven’t. For example, do customers who receive a tailored onboarding journey stay longer and purchase more than those who don’t?
This approach ties journey effectiveness directly to long-term customer value.
7. Repeat Engagement and Frequency
Retention is not just about preventing churn — it’s about fostering consistent, ongoing engagement.
Track how often users who complete a journey return to interact with your brand again. Are they opening future communications, browsing again, or transacting more frequently?
Repeat engagement is a strong signal that your journey has successfully established a relationship that extends beyond the initial interaction.
8. Churn Signals and Negative Behaviors
Sometimes, what customers don’t do is as important as what they do.
Monitor churn signals such as declining engagement rates, reduction in session time, or increased time between purchases. Negative behaviors can help predict future attrition, giving you time to intervene with win-back strategies or revised journey touchpoints.
Proactive measurement of these signals ensures your journeys remain dynamic and responsive.
9. Lifetime Value (LTV) Uplift by Journey Participants
Ultimately, the strongest test of any journey is whether it drives increased lifetime value.
Compare the average LTV of users who complete a journey versus those who don’t. If your journeys are effective, these users should have higher purchase frequency, larger average order value, or greater overall spend over time.
LTV uplift demonstrates that your journey investments are contributing to meaningful commercial outcomes.
10. Feedback Signals: Explicit User Feedback and Preferences
In addition to passive behavioral data, actively seek feedback from journey participants. Quick pulse surveys or preference updates can provide insight into journey effectiveness and satisfaction.
This feedback loop not only measures performance but also allows you to refine personalization and segmentation, making future journeys even more effective.
Conclusion: Moving Beyond Vanity Metrics
If you care about behavior and retention, success isn’t about how many people open an email — it’s about what they do next and how they engage long-term.
At ConSoul, we help brands measure journey effectiveness with a focus on behavior, momentum, and lifetime value, not just campaign performance.
The next time you review your journey metrics, ask yourself: Are we measuring what matters?
Move beyond vanity metrics. Measure real behavior. And design journeys that retain, engage, and convert.


